ETIPS - Make Thinking Visible
Online Simulations as a Strategy for Instruction on Technology Integration
Eric Riedel, Ph.D.
Center for Applied Research & Educational Improvement
University of Minnesota
riedel@umn.edu
Cassie Scharber
Center for Applied Research & Educational Improvement
University of Minnesota
scha0809@umn.edu
Sara Dexter, Ed.D.
Department of Curriculum & Instruction
University of Nevada
sdexter@umn.edu
Paper prepared for the 2004 Annual Meeting of American Educational Research Association, San Diego, CA, April 12-16. Correspondence regarding this paper should be directed to the first author at the Center for Applied Research and Educational Improvement, 275 Peik Hall, 159 Pillsbury Avenue S.E., Minneapolis, MN 55455.
Introduction
The call to better prepare teachers to teach with technology has been repeated several times during the last decade (CEO Forum, 1999, 2000; Office of Technology Assessment, 1995). In response, there are now standards in place to which new teachers are being held (INTASC, 1992; ISTE, 2000) that call for teachers to be able to use technology to plan and design classroom learning environments and experiences, and to support teaching, learning, and the curriculum. Although the standards are in place, the leading teacher education organizations have acknowledged shortcomings in teachers' preparation to use technology as an effective instructional tool (AACTE, 1999; ACE, 1999; NCATE, 1997; NCTAF, 1996). Furthermore, according to the National Center for Education Statistics (NCES) report, Teachers' Tools for the 21 st Century: A Report on Teachers' Use of Technology (2000), almost 70 percent of teachers report not feeling well prepared to use computers and the Internet for classroom instruction. Additionally, researchers report that while preservice teachers may know how to operate technology and use it for personal and professional activities, they still enter teacher education courses without experience in designing technology-integrated instruction (Beaver, 1990; Brooks & Kopp, 1989; Cunningham, 2003; NCES, 2000; Roblyer, 1994).
Many teacher educators promote instructional cases as unique and helpful tools for teacher preparation, including the preparation of teachers in using technology for instructional purposes. Instructional cases include an introduction with a dilemma as well as context information; describe an actual experience, including a "surprise", and suggest a need for judgment and new actions to be taken; require analysis and refection; and generate lingering questions (Shulman, 2002a). Developers of instructional cases recommend that case topics represent authentic problems teachers face---from moral issues to classroom management. Researchers suggest that when properly used, cases can help teachers practice how to think professionally about instructional problems, solutions, and alternatives (Merseth & Lacey, 1993).
Advocates of case-based instruction contend that along with the narrative forms of thinking engaged by cases, it is the case methods of instruction, such as discussion, case sequencing, supplementary writing or reflection activities, and/or feedback, which prompt learners to draw upon and examine their own experiences, opinions, perceptions and misconceptions of educational issues. Shulman (1992) identifies five purposes for the use of case methods in teacher education programs: 1) to teach principles or concepts of a theoretical nature; 2) to develop precedents for practice; 3) to convey moral or ethical principles; 4) to teach strategies, dispositions, reflection, and habits of mind; and 5) to illustrate visions or images of the possible. McAnnich (1993) also notes that the case approach allows learners to build the capacity to look through various theoretical lenses. Case pedagogy requires that instructors not only identify cases and lead discussions on them, but also connect the case ideas to larger issues of practice and key theories (Shulman, 2002b). Shulman (2002b) concludes that four ingredients are necessary for case discussion that fosters learning: 1) a case worth discussing, 2) a clear purpose and/or scaffolding for the discussion, 3) a skillful facilitator who probes and challenges teachers' thinking during the case analysis, 4) an opportunity to see the particular case as an instance of a larger class or type of quandary that arises with some frequency in teaching situations. Many instructors who use cases also feel that an essential part of the process of using case materials is the student-generated analysis of the situation and dialogue about the cases (Flynn & Klein, 2001; Kreber, 2001; Harrington & Garrison, 1992).
Sykes and Bird (1992) review the history of case teaching and identify various approaches that are used such as subject-specific cases and context-specific cases. They recommend that case methods also emphasize careful development of cases and skillful arrangement of them into the curriculum so that instructors can help students learn to apply theory to practice and recognize inherent conflicts, trade-offs, and dilemmas in doing so. Other case developers or advocates argue that the foundation of learning from cases stems from individual preparation (Flynn & Klein, 2001).
The research literature on the impact of cases methods on student learning is limited. In a review of the empirical evidence on the effects of cases on teacher learning, Merseth (1995) notes that the little research that has been done on cases can be broken down into three categories of claims: 1) research about the influence of case on what teachers think about; 2) research on the influence of case on howteachers think, and 3) research on the claims about the context in which individuals consider the cases. Although many advocates of case-based pedagogy claim that cases are effective in helping students develop skills of critical analysis, problem solving, and strategic thinking, these claims have not supported by research (Merseth, 1995). She further notes that there is only limited research on the influence of case-based instruction on classroom performance. Ultimately, Merseth calls for more research on case methods and variations in method, including characteristics of learners, the importance of the instructor, effectiveness of methods, and the quality of the cases themselves (p.270).
This paper is a response to Merseth's (1995) call for more research on case methods, and it describes the implementation of a set of multimedia cases called the eTIP cases in a variety of teacher education courses during the 2002-03 academic year. The eTIP cases offer preservice teachers opportunities to practice technology integration skills in a variety of simulated school and classroom settings. Preliminary findings are presented on the effectiveness of case use in increasing preservice teachers' skills with educational technology. Specifically, we separate individual and classroom factors to explore the conditions which influence individual learning processes with case methods.
Context and Background of eTIP Cases Project
The eTIP Cases project aims to support preservice teacher training through the development of online cases which allow preservice teachers practice in making instructional decisions about technology integration in educational settings. The cases' design utilizes simulated schools' websites to provide "problem spaces" where the users assume the roles of teachers faced with technology integration or implementation problems. Each user is provided with a challenge that outlines his/her role in the scenario and poses a set of questions to answer based on one of six eTIPs (or Educational Technology Integration Principles; Dexter, 2002) selected by their instructor. An example of a challenge based on eTIP 1, learning outcomes drive the selection of technology, is provided below:
Imagine that you are mid-way through your first year as a second grade teacher at H. Usher Elementary school, in an urban location. This is a medium size school, with about 700 students. The consensus is that 2nd grade students are not meeting the district goals and need to advance their reading comprehension at a faster pace. The district goal is to prepare students to improve the school's state ranking on next year's 3rd grade standardized test. During the meeting, the team discussed why the students did not perform as expected. One teacher said she thought family involvement is lacking and students watch too much TV after school. Some of the teachers expressed concern that the class time students are spending on computers is not worthwhile.
Explore the H. Usher school context to understand more about the learning environment in which this situation has occurred. What went wrong and what would you do differently as a second grade teacher at H. Usher Elementary School given the resources that are available? When you are ready, submit your initial thoughts to the second grade team for discussion at next week's grade level meeting by clicking the "Submit Answer" button at left on the school's web pages.
In each simulated school website, users draw on 68 pieces of information which are listed under seven categories (about the school, students, staff, curriculum and instruction, technology infrastructure, school community connections, and professional development) to provide a written answer to the question posed in the case. (See the project website, www.etips.info, for more information.) The eTIP cases software tracks what information the user seeks out, for how long, and in what order. This data is provided as feedback in graphical and numerical formats to the user and the instructor and supplements the student's essay response as a learning indicator.
The eTIP Cases leadership team developed a set of six schools, varied by grade level, urban-rural location, and overall level of effectiveness. The team then recruited teacher education instructors from ten test-bed institutions to implement the cases in preservice teacher technology, foundations, and methods courses. Following a three-day training workshop in June 2002, test-bed instructors implemented the eTIP cases in technology, methods, and foundation teacher education courses during the fall 2002 and spring 2003 academic terms. Formative evaluation data was collected during this time and test-bed instructors met with project staff in January and June 2003 to offer suggestions for improving the software. A revised set of the eTIP cases is currently being tested with a sub-sample of the test-bed instructors during the 2003-2004 academic year.
Methods
The research employed a mixed-method strategy to compare test-bed sites by case implementation and case effectiveness. Analysis of the data emphasized "thick description" of implementation activities, derived from several qualitative data sources, in each of the course sections where the cases were implemented.
Following each semester of implementing the cases in one or more classes, each test-bed faculty member took part in an in-depth implementation interview. Members of the research team completed structured observations of implementation with nine test-bed faculty in fall 2002 and six test-bed faculty in spring 2003. Additional data on implementation was provided through a written survey administered by an external evaluator, examination of faculty use of an online learning environment supporting the cases, instructor focus groups, and course syllabi.
Assessment of the effectiveness of the cases as tools for teaching technology integration was based on both qualitative and quantitative methods. Pre and post-semester surveys provided a self-assessed measure of change in technology integration skill of students. The survey asked teachers to report on their abilities to integrate technology into teaching, their beliefs about effective teaching, and their comfort with technology overall as well as their evaluation of the eTIP cases. In addition, data on individual student's performance in eTIP cases along with essays written in response to case prologues were available for analysis.
Student skills in using technology in teaching were assessed in several ways on the pre and post-semester surveys. One assessment was with the Technology Proficiency Self-Assessment Scale (Knezek et al., 2000; Ropp, 1999) which asked respondents to rate their confidence, using a five point-scale, to perform 18 different technology-related tasks including three involving using technology in teaching: "Create a lesson or unit that incorporates subject-specific software as an integral part of the lesson or unit", "Describe 5 software programs that I would use in my teaching", and "Write a plan to buy technology for my classroom". These three items formed a reliable technology and teaching scale (α=.80 for pre-semester measure).
An additional assessment used to measure student skills in using technology in teaching was through student ratings of 21 tasks, aligned to the ISTE/NETS-T Standards, with which students were asked to rate their preparedness using a four-point scale to complete each of the tasks. Based on a factor analysis with fall 2002 responses, three separate scales were constructed using 15 of these items. These include: Planning with Educational Technology Scale (6 items, alpha=.91 for pre-semester measures); an Individualizing Instruction with Educational Technology Scale (4 items, alpha=.91 for pre-semester measures); and a Managing Educational Technology Scale (5 items). Question wording and scale descriptives are located in Appendix A.
We employed hierarchical linear modeling using HLM 5.04 (Raudenbush, Bryk, & Congdon, 2001) to disentangle individual-level impact of the eTIP cases from the classroom-level impact. This technique allows the impact of individual-level factors on the outcome variable (self-assessed technology integration skill) to vary depending on the class and classroom-level factors. Hierarchical linear modeling avoids the problem typically associated with using ordinary least squares regression with nested data – violation of the assumption that subjects are independent of on another. In the present case, where classroom conditions and use of the eTIP cases varies considerably, the use of hierarchical linear models is more appropriate and has the advantage of explicitly modeling classroom-level effects rather than assuming they are uniform across classrooms.
We compared three models for assessing whether the degree to which individuals rated the cases as useful learning tools was predictive of pre-post changes in self-assessed skill or whether the impact of the individual's rating of the cases was dependent on how the cases were implemented in the classroom. Cases in each model were weighted by both measures.
The first model, which served as the baseline model, did not specify any impact for the eTIP cases, regardless of individual or classroom level. The level-1 model specified that a person's self-assessed skill on the post-semester survey was a function of his/her pre-semester survey self-assessed skill (B1), an average self-rating score after adjusting for the pre-semester survey skill level (B0), and a random error component associated with each individual. The level-2 model specified that the average self-rated score (B0) was a function of an average classroom level effect (G0), an effect associated with if the student was enrolled in an educational technology course (G1), and a random error component associated with each class (U0). The impact of pre-semester survey self-assessed skill is modeled as being the same for all classes (G10).
(Level 1) Y = B0 + B1 (PRE-SEMESTER SKILL) + R
(Level 2) B0 = G0 + G1 (TECH CLASS) + U0
B1 = G10
The second model builds on the baseline model by adding a term for individual-level rating of how useful the student found the cases to be in learning about technology integration (B2). This function predicting the individual rating of case usefulness is allowed to vary by class in the level-2 model and is represented by an error term (U1).
(Level 1) Y = B0 + B1 (PRE-SEMESTER SKILL) + B2 (CASE RATING + R
(Level 2) B0 = G0 + G1 (TECH CLASS) + U0
B1 = G10
B2 = G20 + U1
The third model builds on the earlier two models by adding a term for the classroom-level implementation of cases. This is a dichotomous variable representing whether the student was in a class where the cases were implemented strongly or not (G21). Classrooms where the instructor discussed every assigned case and used multiple assessment features associated with the cases (e.g. search-path maps, relevancy scores, and online essay grading tool) are classified as having a strong implementation. Class implementation was modeled as a predictor of the relationship between how useful individuals rated the cases and the subsequent gains made on their self-assessed technology integration skill. This function predicting the individual rating of case usefulness is still allowed to vary by class in the level-2 model.
(Level 1) Y = B0 + B1 (PRE-SEMESTER SKILL) + B2 (CASE RATING) + R
(Level 2) B0 = G0 + G1 (TECH CLASS) + U0
B1 = G10
B2 = G20 + G21 (IMPLEMENTATION) + U1
Sample
The cases were implemented at ten different institutions, divided evenly between large public universities and small, private liberal arts colleges. The sample includes only those test-bed courses where at least three students completed pre and post-semester surveys and the students successfully completed at least two cases as assigned by the instructor. The final sample includes 243 students from 18 different course sections taught by 12 different instructors. Table 1 shows the characteristics of each of those classes arranged by semester.
Results
Patterns of Use by Instructors
Table 1 shows that the strength of implementation, as measured by its integration within the course and instructor's use of assessment features, varied considerably among test-bed members. At the lowest ends of implementation were those instructors who typically used a portion of a class period to introduce the project and the assignment to use the eTIP cases. Students would work on the cases as homework outside of class. The cases were not discussed in subsequent classes and students received summative feedback in the form of grades on the essays written with the cases. In interviews about implementation, these instructors generally reported that more time was not given to the cases due to the need to cover many topics in the course. This was especially true of instructors who implemented at low levels within educational technology courses.
At the highest levels of implementation, instructors used class time to introduce the cases including sometimes working through the first case as an example. The assigned cases were worked both inside and outside of class as well as individually and within groups. The process was iterative to some degree, alternating between individual or group work on the cases and class discussion. Instructors made use of formative assessment tools, though not necessarily for every case. A typical example of this would be students using search path maps to compare their search for case information with that of another student.
One of the main trends that emerged in implementation activities was that faculty adapted the cases in specific ways to their courses. Although instructors were trained in a suggested curriculum in a workshop preceding the implementation year, they quickly amended the curriculum to fit their course and their own ideas of effective teacher training. These adaptations appeared to increase the extent that instructors used class time to discuss and work through the cases with students. For example, one instructor asked students to compare the simulated schools in the case with their current field work assignments and how their tasks in the cases compared with problems they might have encountered as student teachers. Instructors also made connections between the cases and their courses using themes other than technology integration. For example, one of the strongest implementers asked student to peer grade one another's case essays and compare those grades to ones assigned by the instructor and themselves. This aided a discussion of the nature of assessment. This instructor also added a question on democratic schooling to the case questions.
Given that this was the first year of test-bed implementation for the cases, technical problems were not unusual and were reported by nearly all instructors. Many of these problems included difficulty accessing the cases, either logging on initially or returning to the same place in the case once a student had left. There were also problems using some assessment features including printing search path maps or having instructor grades available to students through the online essay grading tool. Instructors reported that technical problems often depressed student enthusiasm for the cases. Somewhat surprisingly, however, technical problems bore only a weak relationship to the degree to which instructors implemented the cases in their courses. Some of the weak implementers reported few problems while some of the strongest implementers reported pervasive difficulties. This weak relationship was likely due to the fact that the development aspect of the project was stressed to the instructors who attended a mid-year project meeting in January 2003 to talk with project staff about their experiences with the cases and receive further training.
Analysis of open-ended student comments regarding the cases and faculty interviews revealed what they viewed as the strengths and weaknesses of the cases. Both students and instructors reported that they found exposure to the schools to be informative – not only about technology integration but about schools in general. Instructors almost unanimously viewed the schools as rich environments which were amenable to other case questions besides technology integration. The scope of information available in each school was viewed both positively and negatively by faculty with regards to student learning. Some faculty (and students) stated that the schools were a good opportunity for students with little exposure to K12 schools to become acquainted with the different elements of a school. Other faculty suggested that the large amounts of information available made this a difficult exercise for students without classroom or school experience – these students lacked the basic knowledge to conduct an effective search for information to answer the case question.
Changes in Self-Assessed Skill by Individual and Course
Table 2 presents the initial levels of self-assessed technology skill and gains over the academic term for each class. All four measures of skill are presented. Each course that implemented the cases is coded as having a strong implementation if they discussed each assigned case in class and made use of multiple assessment features with the cases. Statistically significant gains are made on all four measures for each of the technology courses. This finding is not surprising; however, it does suggest that differences due to case use may not be detected due to the number of factors within an educational technology course that could influence these measures. There is no clear pattern among the test-bed methods and foundation courses in fall 2002 and spring 2003 in terms of differences between those who had a strong implementation and those who did not.
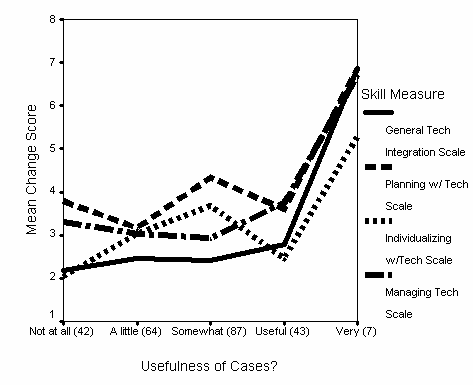
Figure 1 shows the mean change scores for each scale by rating of eTIP case usefulness in learning about educational technology integration. The largest difference is between those who rated the cases "very useful" and other ratings – especially for the general technology integration scale. Between other ratings of usefulness, there are slightly greater gains in technology integration skill as the usefulness rating increases.
Results of Hierarchical Linear Models
The three hierarchical linear models are repeated and compared with one another for each of the four scales measuring technology integration skill. The results from these models test the two hypotheses that individual's experience with the eTIP cases is predictive of gains in technology integration skill and that the impact of this experience is strengthened by classroom conditions which encourage reflection on technology integration decision making. The hierarchical linear models offer three kinds of evidence with which to test the hypotheses: (1) statistical significance of the fixed effects of individual rating of the eTIP cases and classroom implementation conditions; (2) statistical significance of the random effects which indicate whether variance remains to be explained; and (3) a statistical comparison of the three models to indicate whether incorporating variables of case usefulness and classroom implementation significantly improves the statistical fit of the model.
Tables 3a-3c illustrate the results when using the general technology integration scale. The individual rating of case usefulness proves a statistically significant predictor of gains made in that scale but classroom implementation does not. There remains significant variation in the average gain in technology integration achieved but not in individual ratings of case usefulness. Taking into account case usefulness, however, does lead to a statistically better model than not using it; taking into account whether or not a full implementation occurred does not lead to a better model.
Tables 4a – 4c show the results when using the planning with technology scale. The individual case usefulness rating achieves only marginal statistical significance (p < .10) and only in the second model. Including this scale does, however, significantly improve the statistical fit of the model (table 4c), although including a variable for classroom implementation does not appear to do so. There remains significant variation to be explained in average gains in the outcome variable and individual ratings of case usefulness. The results are identical when using the individualizing technology scale (tables 5a=5c). Case usefulness has an impact at a marginal level of statistical significance but improves the fit of the model when included; classroom implementation does not have an impact.
The results for managing technology in schools scale are presented in Tables 6a-6c. Case usefulness has a statistically significant effect in the second model but not in the third. Classroom implementation has an effect but only at a marginally statistically significant level (p < .10). Again, the inclusion of a variable measuring case usefulness improves the statistical fit of the model but the inclusion of a variable measuring full implementation of the cases does not. Also, like the previous models, there appears to be significant classroom-level variation in the average gain in technology skill as well as ratings of case usefulness that remain to be explained.
Taken together, these models illustrate a couple of overall patterns. First, individual ratings of eTIP case usefulness as a learning tool proves to be a significant predictor of self-assessed gain in technology integration skill. A modest interpretation is that how individuals viewed their own technology integration skills is related to how they judged their own experiences with the cases. (This interpretation is evident after accounting for some classroom-level differences in gains made in technology integration skill over each course.) Second, full implementation, as defined here, generally does not prove to be a significant predictor of how students rate the cases. There is, however, significant variation between classes around ratings of case usefulness that remains to be explained. This variation suggests that alternative assessments of classroom implementation of the cases may yet prove significant.
To assure that these results were not an artifact of the small number of individuals who rated the cases as "very useful", the variable of case usefulness was recoded and the categories of "useful" and "very useful" were collapsed. The above hierarchical linear models were repeated with the new variable. The results were replicated in each model.
Summary
The results of this study show that students' individual experiences with the eTIP cases are positively related to gains made in some measures of self-assessed technology integration skill. Such experiences are at least partially dependent on how the cases are used in teacher education classrooms. Evidence, in the form of observations and interviews with instructors, reveals considerable variation in the way each instructor adapted the cases for his/her own use – far outside the scope of use originally imagined by project staff. Therefore, it was important to analyze the impact of individual case experiences as dependent on classroom context. Although the current measure of classroom implementation (full implementation versus not) did not have statistical significance as a predictor of student ratings of the cases, the analyses revealed significant classroom-level variation in the student ratings.
Discussion
Merseth (1995) calls for further research on the influence of student characteristics, the importance of the instructor, and the effectiveness of case methods. This paper represents a first step in a design which integrates all three research areas. The nested design employed here is particularly appropriate for responding to the questions raised by Merseth.
The main limitation of this study was the measures used. Asking students to rate the usefulness of cases in learning about educational technology integration assumes that students are conscious of their learning. Given that one of the primary goals of the eTIP Cases project is to increase students' metacognition around technology integration decisions, this assumption may not be an unreasonable one. Regardless, other individual-level measures should be explored. These measures could include students' behavior with cases (e.g. how many cases were completed, the extent of the information searched within the case, and the time spent searching.) Alternative measures of student learning could also be employed including measures of the ability to make high-quality decisions regarding technology (e.g. content analysis of case essays).
Further research is needed to describe and explain classroom-level variation in case implementation. Other measures of classroom implementation, such as completion of cases inside or outside of the classroom and the strength of the case integration into the course as a whole, may prove to have more predictive power in explaining this variation. Alternatively, it may be a measure of fidelity to case methodology which proves to play the critical role rather than the extent of case implementation in determining how useful the cases are in improving preservice teachers' technology integration skills.
References
Bransford, John D., et al. (1986). Learning with technology: theoretical and empirical perspectives. Peabody Journal of Education, 64(1), 5-26.
Beaver, J. (1990). A profile of undergraduate educational technology (in)competence: Are we preparing today's education graduates for teaching in the 1990's? Research Report. Buffalo, NY: SUNY at Buffalo. (ERIC Document Reproduction Service No. ED 332 985).
Brooks, D., & Kopp, T. (1989). Technology in teacher education. Journal of Teacher Education, 40, 2-7.
Cunningham, Ann. (2003) Creating a context for meaningful technology integration . Journal of Computing in Teacher Education, 19, 71-72.
Dexter, S. (2002). ETIPS: Educational technology integration and implementation principles. In P. Rodgers (Ed.), Designing instruction for technology-enhanced learning (pp. 56-70). New York: Idea Group Publishing.
Flynn, Anna E., & Klein, James D. (2001). The influence of discussion groups in a case-based learning environment. Educational Technology Research and Development, 49 (3), 71-86.
Goldman, Elizabeth, & Barron, L. (1990). Using hypermedia to improve the preparation of elementary teachers. Journal of Teacher Education, 41 (3), 21-31.
Goldman, Elizabeth, et al. (1991). Hypermedia cases in teacher education: a context for understanding research on the teaching and learning of mathematics. Action in Teacher Education, 13 (1), 28-36.
Harrington, Helen L., & Garrison, James W. (1992). Cases as shared inquiry: a dialogical model of teacher preparation. American Education Research Journal, 29 (4), 715-736.
Kagan, D.M. (1993). Contexts for the use of classroom cases. American Education Research Journal, 30 (4), 703-723.
Knezek, G. A., Christensen, R. W., Miyashita, K. T. & Ropp, M.M. (2000). Instruments for assessing educator progress in technology integration Denton, TX: Institute for the Integration of Technology into Teaching and Learning. Retrieved on 13 January 2003
Kreber, Carolyn (2001). Learning experientially through case studies? A conceptual analysis. Teaching in Higher Education, 6 217-228.
Lacey, Catherine A., & Merseth, Katherine K. (1993). Cases, hypermedia and computer networks: three curricular innovations for teacher education. Journal of Curriculum Studies,25(6), 543-551.
McAninch, Amy. (1993). Teacher thinking and the case method. New York: Teachers College Press.
Merseth, K.K. (1990). Beginning teachers and computer networks: A new form of induction support. E. Lansing, MI: National Center for Research on Teacher Education.
Merseth, K. (1995). Cases and case methods in teacher education. In J. Sikula (Ed .), Handbook of research on teacher education. New York: Macmillan.
Merseth, K.K., & Lacey, C.A. (1993). Weaving stronger fabric: the pedagogical promise of hypermedia and case methods in teacher education. Teacher & Teacher Education, 9 (3), 283-299.
National Center for Education Statistics (2000). Public school teachers' use of computers and the Internet. Washington, D.C.: U.S. Department of Education.
Raudenbush, S., Bryk, A., & Congdon, R. (2001). HLM for Windows. Version 5.04. HLM Software.
Roblyer, M.D. (1994). Creating technology using teachers: A model for preservice technology training. Report of a Florida DOE-funded project, Tallahassee, Fl.
Ropp, M. M. (1999). Exploring individual characteristics associated with learning to use computers in preservice teacher preparation. Journal of research on computing in education , 31(4), 402-424.
Shulman, J. H. (1992). Case methods in teacher education. New York: Teachers College Press.
Shulman, J (2002a, February). The effective use of on-line video vase studies. Presentation at the AACTE conference, New York, New York.
Shulman, J. (2002b). Happy accidents: Cases as opportunities for teaching learning. Presentation at the AERA conference, New Orleans, Louisiana.
Sykes, Gary, & Bird, Tom. (1992). Teacher education and the case idea. Review of Research in Education, 18 , 457-521.
Table 1: Description of Study Sample
|
Faculty Member |
Course |
Institution |
Number in Panel |
Mean Rating of eTIP Case Usefulness (1-5) |
# Cases Discussed in Class / Cases Completed |
Use of Multiple Assessment Features? |
|
Fall 2002 Test-Bed Sites |
||||||
|
A1 |
F |
Private Liberal Arts College |
12 |
2.33 |
0/3 |
No |
|
B1 |
F |
Private Liberal Arts College |
11 |
1.27 |
1/3 |
No |
|
C1 |
M |
Public University |
4 |
3.00 |
2/3 |
Yes |
|
D1 |
M |
Public University |
3 |
2.33 |
3 / 4 |
No |
|
E1 |
F |
Public University |
26 |
2.85 |
2 / 4 |
No |
|
F1 |
F |
Private Liberal Arts College |
16 |
2.50 |
3 / 4 |
Yes |
|
G1 |
M |
Private Liberal Arts College |
14 |
2.93 |
4 / 4 |
Yes |
|
G2 |
M |
Private Liberal Arts College |
11 |
2.73 |
4 / 4 |
Yes |
|
K1 H1 |
F |
Public University |
13 |
3.15 |
2 / 4 |
Yes |
|
I1 |
T |
Public University |
16 |
3.19 |
0 / 3 |
No |
|
J1 |
F |
Public University |
12 |
1.83 |
2 / 3 |
Yes |
|
Spring 2003 Test-Bed Sites |
||||||
|
A2 |
T |
Private Liberal Arts College |
13 |
1.92 |
1 / 3 |
No |
|
C2 |
M |
Public University |
4 |
2.00 |
2 / 3 |
Yes |
|
C3 |
M |
Public University |
7 |
3.86 |
4 / 4 |
Yes |
|
H2 |
F |
Public University |
25 |
2.80 |
3 / 3 |
Yes |
|
I2 |
T |
Public University |
19 |
1.79 |
1 / 3 |
No |
|
K1 |
T |
Public University |
15 |
2.87 |
1 / 3 |
No |
|
L1 |
T |
Public University |
22 |
3.23 |
3 / 3 |
Yes |
Table 2: Levels of Self-Assessed Skill with Instructional Technology by Course Section
|
Faculty |
Strong Use? |
Course |
General Teaching w/ Technology Scale |
Planning Technology Integration Scale |
Individualizing Instruction w/ Technology Scale |
Managing Technology Scale |
||||
|
Initial |
Gain |
Initial |
Gain |
Initial |
Gain |
Initial |
Gain |
|||
|
Fall 2002 Test-Bed Sites |
||||||||||
|
A1 |
F |
8.0833 |
2.0833 |
11.7500 |
***4.4167 |
6.1667 |
*1.9167 |
9.5000 |
***3.0833 |
|
|
B1 |
F |
9.0909 |
**2.1818 |
16.2727 |
.4545 |
10.4545 |
.3636 |
12.3636 |
1.5455 |
|
|
C1 |
M |
10.50000 |
1.0000 |
18.7500 |
*1.7500 |
9.2500 |
.7500 |
16.500 |
1.0000 |
|
|
D1 |
M |
11.6667 |
.3333 |
17.3333 |
3.6667 |
12.3333 |
3.3333 |
13.6667 |
3.0000 |
|
|
E1 |
F |
7.2692 |
***2.1154 |
14.1923 |
**3.1538 |
7.3462 |
**2.2692 |
10.9615 |
**2.4615 |
|
|
F1 |
F |
9.4375 |
.2500 |
15.6250 |
1.6250 |
9.7500 |
1.3125 |
12.4375 |
1.4375 |
|
|
G1 |
X |
M |
10.4286 |
**2.0000 |
19.2857 |
-.5000 |
10.3571 |
.9286 |
14.8571 |
1.5714 |
|
G2 |
X |
M |
10.7273 |
1.4545 |
18.0000 |
1.5455 |
10.0000 |
*2.4545 |
15.7273 |
2.3636 |
|
K1 H1 |
F |
10.2308 |
1.3077 |
16.1538 |
**2.7692 |
8.4615 |
***3.2308 |
12.9231 |
***2.9231 |
|
|
I1 |
T |
8.8125 |
***3.6875 |
15.5000 |
**4.6250 |
7.8125 |
***4.9375 |
11.5625 |
***5.2500 |
|
|
J1 |
F |
8.1667 |
*1.5000 |
13.1667 |
3.2500 |
6.4167 |
1.8333 |
10.50000 |
2.1667 |
|
|
Spring 2003 Test-Bed Sites |
||||||||||
|
A2 |
T |
8.6923 |
**3.0000 |
16.6923 |
*3.9231 |
9.0000 |
*3.0000 |
13.2308 |
**2.7692 |
|
|
C2 |
M |
12.0000 |
**2.5000 |
17.5000 |
*4.7500 |
9.2500 |
*4.5000 |
14.50000 |
3.7500 |
|
|
C3 |
X |
M |
8.8571 |
1.8571 |
13.2857 |
***5.8571 |
7.8571 |
*2.7143 |
10.1429 |
**3.5714 |
|
H2 |
X |
F |
9.6000 |
***2.3600 |
15.0800 |
***4.0000 |
8.7600 |
***3.0800 |
12.2800 |
***3.1600 |
|
I2 |
T |
7.4737 |
***4.5263 |
13.2632 |
***7.0526 |
7.7895 |
***5.1053 |
9.8421 |
***6.2632 |
|
|
K1 |
T |
8.0000 |
***3.8000 |
13.3333 |
***5.9333 |
6.8000 |
***4.6667 |
11.1333 |
**3.6000 |
|
|
L1 |
X |
T |
6.6818 |
***5.1364 |
12.3182 |
***7.5000 |
7.0455 |
***5.4545 |
9.9545 |
***5.7273 |
* p < .05, ** p < .01, *** p < .001 based on paired t-test.
Table 3a. Fixed Effects for General Technology Skill Scale
|
Model |
|||
|
Baseline: No Effect for Cases |
Individual Effect Only |
Classroom Moderation of Individual Effect |
|
|
Coefficient (standard error) |
coefficient (standard error) |
coefficient (standard error) |
|
|
Intercept |
*** 11.243 (.259) |
*** 8.901 (.482) |
*** 8.958 (.482) |
|
Technology Class |
** 1.753 (.454) |
*** 1.577 (.322) |
*** 1.618 (.321) |
|
Usefulness of Cases Intercept |
**** 0.773 (.128) |
*** 0.717 (.147) |
|
|
Full Implementation |
0.056 (.085) |
||
|
Pretest Intercept |
*** 0.420 (.053 |
*** 0.471 (.048) |
*** 0.475 (.048) |
|
Deviance |
1107.428 (df=2) |
1056.796 (df=4) |
1061.438 (4) |
+ p < .10, * p < .05, ** p < .01, *** p < .001
Table 3b. Random Effects for General Technology Skill Scale
|
Model |
Variance Component |
df |
X2 |
p-value |
|
|
No Effect |
Intercept U0 |
0.321 |
16 |
28.941 |
.024 |
|
Level-1 R |
5.311 |
||||
|
Individual Effect Only |
Intercept U0 |
1.683 |
16 |
27.795 |
.033 |
|
Q18 Slope, U1 |
0.968 |
17 |
22.481 |
.167 |
|
|
Level-1 R |
4.278 |
||||
|
Classroom Moderation of Individual Effect |
Intercept U0 |
1.655 |
16 |
27.809 |
.033 |
|
Q18 Slope, U1 |
0.107 |
16 |
23.663 |
.097 |
|
|
Level-1 R |
4.298 |
Table 3c. Comparison of Models for General Technology Skill Scale
|
Comparison |
Chi-Square |
df |
p-value |
|
Model 1 vs. Model 2 |
50.632 |
2 |
< .001 |
|
Model 1 vs. Model 3 |
45.990 |
2 |
< .001 |
Table 4a. Fixed Effects for Planning with Technology Scale
|
Model |
|||
|
Baseline: No Effect for Cases |
Individual Effect Only |
Classroom Moderation of Individual Effect |
|
|
Coefficient (standard error) |
coefficient (standard error) |
coefficient (standard error) |
|
|
Intercept |
*** 18.309 (.416) |
*** 16.779 (.845) |
*** 16.819 (.849) |
|
Technology Class |
** 2.395 (.729) |
*** 2.237 (.546) |
** 2.320 (.551) |
|
Usefulness Intercept |
+ 0.459 (.268) |
0.361 (.290) |
|
|
Full Implementation |
0.157 (.166) |
||
|
Pretest Intercept |
*** 0.346 (.051) |
*** 0.369 (.049) |
*** 0.367 (.049) |
|
Deviance |
1241.478 (2) |
1216.346 (4) |
1219.094 (4) |
+ p < .10, * p < .05, ** p < .01, *** p < .001
Table 4b. Random Effects for Planning with Technology Scale
|
Model |
Variance Component |
df |
X2 |
p-value |
|
|
No Effect |
Intercept U0 |
1.165 |
16 |
41.546 |
.001 |
|
Level-1 R |
9.043 |
||||
|
Individual Effect Only |
Intercept U0 |
7.082 |
16 |
32.785 |
.008 |
|
Q18 Slope, U1 |
0.734 |
17 |
38.287 |
.003 |
|
|
Level-1 R |
7.951 |
||||
|
Classroom Moderation of Individual Effect |
Intercept U0 |
7.143 |
16 |
32.697 |
.008 |
|
Q18 Slope, U1 |
0.772 |
16 |
39.180 |
.001 |
|
|
Level-1 R |
7.945 |
Table 4c. Comparison of Models for Planning with Technology Scale
|
Comparison of Models |
Chi-Square |
df |
p-value |
|
Model 1 vs. Model 2 |
25.132 |
2 |
< .001 |
|
Model 1 vs. Model 3 |
22.386 |
2 |
< .001 |
Table 5a. Fixed Effects for Individualizing Instruction with Technology Scale
|
Model |
||||
|
Baseline: No Effect for Cases |
Individual Effect Only |
Classroom Moderation of Individual Effect |
||
|
Coefficient (standard error) |
coefficient (standard error) |
coefficient (standard error) |
||
|
Intercept |
*** 10.767 (.333) |
*** 9.539 (.725) |
*** 9.606 (.723) |
|
|
Technology Class |
** 2.172 (.585) |
*** 1.981 (.421) |
*** 2.089 (.425) |
|
|
Usefulness Intercept |
+ 0.426 (.214) |
0.302 (.235) |
||
|
Full Implementation |
0.190 (.123) |
|||
|
Pretest Intercept |
*** 0.344 (.052) |
*** 0.385 (.052) |
*** 0.385 (.052) |
|
|
Deviance |
1138.533 (2) |
1110.657 (4) |
1112.899 (4) |
|
+ p < .10, * p < .05, ** p < .01, *** p < .001
Table 5b. Random Effects for Individualizing Instruction with Technology Scale
|
Model |
Variance Component |
Df |
X2 |
p-value |
|
|
No Effect |
Intercept U0 |
0.751 |
16 |
45.410 |
> .001 |
|
Level-1 R |
5.903 |
||||
|
Individual Effect Only |
Intercept U0 |
5.788 |
16 |
41.219 |
.001 |
|
Q18 Slope, U1 |
0.485 |
17 |
42.955 |
.001 |
|
|
Level-1 R |
5.103 |
||||
|
Classroom Moderation of Individual Effect |
Intercept U0 |
5.688 |
16 |
41.685 |
.001 |
|
Q18 Slope, U1 |
0.536 |
16 |
44.891 |
>.001 |
|
|
Level-1 R |
5.076 |
Table 5c. Comparison of Models for Individualizing Instruction with Technology Scale
|
Comparison |
Chi-Square |
df |
p-value |
|
Model 1 vs. Model 2 |
27.876 |
2 |
> .001 |
|
Model 1 vs. Model 3 |
25.634 |
2 |
> .001 |
Table 6a. Fixed Effects for Managing Technology in Schools Scale
|
Model |
|||
|
No Effect |
Individual Effect Only |
Classroom Moderation of Individual Effect |
|
|
coefficient (standard error) |
coefficient (standard error) |
coefficient (standard error) |
|
|
Intercept |
*** 14.872 (.335) |
*** 13.034 (.643) |
*** 13.151 (.655) |
|
Technology Class |
** 2.125 (.587) |
** 1.856 (.528) |
** 1.944 (.457) |
|
Usefulness Intercept |
* 0.600 (.221) |
0.396 (.253) |
|
|
Full Implementation |
+ 0.320 (.154) |
||
|
Pretest Intercept |
*** 0.463 (.050) |
*** 0.475 (.046) |
*** 0.476 (.045) |
|
Deviance |
1190.926 (df=2) |
1160.500 (df=4) |
1160.937 (df=4) |
+ p < .10, * p < .05, ** p < .01, *** p < .001
Table 6b. Random Effects for Managing Technology in Schools Scale
|
Model |
Variance Component |
df |
X2 |
p-value |
|
|
No Effect |
Intercept U0 |
0.646 |
16 |
37.012 |
.002 |
|
Level-1 R |
7.428 |
||||
|
Individual Effect Only |
Intercept U0 |
2.901 |
16 |
31.709 |
.011 |
|
Q18 Slope, U1 |
0.421 |
17 |
39.8214 |
.002 |
|
|
Level-1 R |
6.339 |
||||
|
Classroom Moderation of Individual Effect |
Intercept U0 |
3.419 |
16 |
31.882 |
.010 |
|
Q18 Slope, U1 |
0.557 |
16 |
42.805 |
< .001 |
|
|
Level-1 R |
6.322 |
Table 6c. Comparison of Models for Managing Technology in Schools Scale
|
Comparison |
Chi-Square |
df |
p-value |
|
Model 1 vs. Model 2 |
30.426 |
2 |
< .001 |
|
Model 1 vs. Model 3 |
29.989 |
2 |
< .001 |
Figure 1. Rating of eTIP Case Usefulness in Learning about Educational Technology Integration by Mean Change in Technology Integration Skills
Appendix A: Survey Question Wording
General Educational Technology Skill Scale Items
I feel confident that I could . . .
(1=Strongly Disagree, 2=Disagree, 3=Undecided, 4=Agree, 5=Strongly Agree)
a. Create a lesson or unit that incorporates subject-specific software as an integral part of the lesson or unit.
b. Describe 5 software programs that I would use in my teaching.
c. Write a plan with a budget to buy technology for my classroom.
Overall Instructional Technology Skill
Rate your overall skill with using technology in support of your professional practice:
(1=Non-user, 2=Novice, 3=Intermediate, 4=Advanced, 5=Expert)
Planning with Educational Technology Scale Items
The statements below refer to different tasks you might do as a teacher. Please check the box that indicates how prepared you feel currently to do each. (1=Not prepared, 2=A little prepared, 3=Somewhat prepared, 4=Well prepared)
a. Consider technology when designing lessons or units.
b. Use research related to effective use of learning technology when planning lessons or structuring classroom environments.
c. Evaluate a range of educational technologies on their appropriateness for particular classroom uses.
d. Locate and access educational technology resources.
g. Plan developmentally appropriate classroom instruction and student activities that utilize technology.
l. Use technology to develop students' higher order thinking skills and creativity.
Individualizing Instruction with Technology Scale Items
The statements below refer to different tasks you might do as a teacher. Please check the box that indicates how prepared you feel currently to do each. (1=Not prepared, 2=A little prepared, 3=Somewhat prepared, 4=Well prepared)
p. Judge whether you or your students have appropriate access to technology to use a particular lesson.
q. Judge whether technical support in a school is sufficient to use technology in a particular lesson.
r. Monitor and manage what students learn in technology rich learning environments.
s. Coordinate available technology and classroom schedules when planning to integrate technology in a lesson.
u. Collaborate with other teachers in planning for technology integration in a classroom or school.
Managing Educational Technology Scale Items
The statements below refer to different tasks you might do as a teacher. Please check the box that indicates how prepared you feel currently to do each. (1=Not prepared, 2=A little prepared, 3=Somewhat prepared, 4=Well prepared)
e. Use technology to meet the needs of special needs students.
f. Use technology to assess student learning.
j. Individualize technology use for students with diverse needs or abilities.
k. Draw on strategies for using technology to individualize instruction, including meeting the needs of special populations.
Rating the Usefulness of eTIP Cases
To what extent were the eTIP cases useful or not useful in learning about technology use in education?
(1=Not at all useful, 2=A little useful, 3=Somewhat useful, 4=Useful, 5=Very useful)