
ETIPS - Make Thinking Visible
Technical Report 2: Analysis of ETIPS Case Essay Scores
Eric Riedel, Ph.D.
Center for Applied Research and Educational Improvement (CAREI)
University of Minnesota
David Gibson, Ph.D.
The Vermont Institutes
Abstract
Characteristics of scores assigned to ETIP case essays were explored. Two essay scoring rubrics were tested in 2002-2003 with 133 preservice teachers in 12 courses using the cases. Instructors made greater use of the full range of values (1-3) for each criterion with a seven-score rubric employed in fall 2002 than a three-score rubric employed in spring 2003. Overall, individual scores were strongly associated with one another for a student on a given case. Scores were only moderately correlated across cases for the same individual. There was no evidence of systematic growth in essay scores over time with either rubric.
Report prepared for the ETIP Cases Project on January 13, 2004. Correspondence regarding this paper can be directed to the first author at the Center for Applied Research and Educational Improvement (CAREI), University of Minnesota, 275 Peik Hall, 159 Pillsbury Avenue SE, Minneapolis, MN 55455, riedel@umn.edu .
Executive Summary
The following paper examined characteristics of scores assigned by ETIP Cases test-bed instructors to essays written by their students in response to the ETIP case, an educational simulation designed to allow preservice teachers to practice making technology integration decisions. Given that the essay scoring rubric differed between the two semesters, the analyses were conducted separately. Fall 2002 cases followed a six criteria rubric plus an overall global score. Spring 2003 cases followed a three criteria rubric plus an overall global score. The sample over the two semester included essay scores from 133 students in 12 foundations, methods, or educational technology classes taught by 9 different faculty and instructors.
Essay scores from fall 2002 cases were more evenly distributed than those given in spring 2003. Instructors made greater use of the full range of values for each score (1-3) in fall 2002 than in spring 2003. In spring 2003, students were disproportionately scored on the high end of each criterion.
Within a given semester, scores were strongly associated with one another on a given case. For example, a student who received a high score on one criterion for the first case essay was likely to receive a high score on different criteria for the same case essay. Scores were only moderately associated across cases for the same individual.
Possible sources in essay score variation include the instructor, class, ETIP case, or student. Analyses suggested the ETIP case itself and differences among individual students had more impact on variation in essay scores than instructor or class. In spring 2003, for example, there were no statistically significant differences in the median scores assigned by different instructors in different classes using the same ETIP case. There was no evidence of change in essay scores over time for either semester.
Introduction
The Educational Theory into Practice Software (ETIPS) originated with a grant in 2001 from the U.S. Department of Education's Preparing Tomorrow's Teachers to Use Technology (PT3) program. Since its inception these online cases were designed to provide a simulated school setting in which beginning teachers could practice decision-making regarding classroom and school technology integration guided by the Educational Technology Integration and Implementation Principles (eTIPs). In each case, users are given a case challenge based on one of these six principles about how they would use educational technology in the specific scenario[1]. They then can search out information about the school staff, students, curriculum, physical setting, technology infrastructure, community, and professional development opportunities. After responding to the case challenge in the form of a short essay, users are given feedback about their essay and case search. (Readers can view cases at http://www.etips.info/.)
The present paper draws on research and evaluation data gathered on the actual use of the cases during part of the 2002-2003 test phase of the cases. It is part of a series of technical papers aimed at informing project staff, users of these cases, and researchers of educational technology more generally. This paper focuses on scores assigned to user essays by instructors under two versions of a scoring rubric provided by the project to score essays written by students in answer to case challenges presented in each case. (Readers unfamiliar with the ETIP cases can refer to Appendix A for an example of a case challenge and essay response from Spring 2003.) These rubrics were embedded within the case software in an online scoring tool for instructor use. The first version of the rubric was used in fall 2002 semester with ETIPS project "test-bed" courses while the second version was used in the spring 2003 semester. The analyses below seek to answer the following questions about the scores assigned to these essays:
- What are the characteristics of the essay scores?
- To what degree are scores associated with one another over time?
- How do they change over time?
Method
Given that the rubric content and structure changed between the fall 2002 and spring 2003 semesters, the analyses were separated by semester. Nonparametric statistics are used throughout the analyses due to the limited range of scores, the lack of normal distributions for some scores, and the low number of cases for some analyses. Minor exceptions are made with the use of means to aid description. Nonparametric statistics or distribution free statistics are a set of techniques that make less stringent assumptions about the data. They are less well known than some of their parametric equivalents (t-test, ANOVA, regression) which assume that the data come from an approximately normal distribution and are measured at an interval level (equal intervals between data points). The main consequence of violating these assumptions is that statistical tests will place undue emphasis on some cases in the data rather than others (e.g. outliers, extreme ends of the variable's distribution). Nonparametric tests tend rely primarily on ranking (from high to low) or counting data (e.g. number of yes's versus no's) rather than means and distance from means used in most parametric tests.
Sample
The sample consists of students enrolled in a teacher education class at one of seven (out of ten) ETIP Cases test-bed institutions during the 2002-2003 academic year. Since not all participating test-bed instructors chose to use the recommended rubric and online scoring tool, the sample for the following analysis is necessarily a sub-set of the larger test-bed sample. It includes 133 students in 12 foundations, methods, or educational technology classes taught by 9 different faculty and instructors. The case assignments varied among instructors with faculty and instructors choosing the number of assigned cases (1-4) and eTIP focus (1-6) depending on the needs of the course and their approach to implementing the cases in their course. Faculty and instructors also select whether the cases involved elementary students (K-6), intermediate and secondary students (7-12), or both. The sample was allowed to vary by these conditions with the exception that when a faculty or instructor allowed students to use either cases with elementary or middle/secondary students, only part of the class was included in the case analysis over time to insure consistency within class.
Data for the following analyses were collected automatically by the software although additional information (used in other technical papers) was collected through the use of a pre-semester survey. The software collected information on what information the user searched, in what order they searched, and the essay written at the end of the case in response to a general question posed about technology integration. Information from a user was included if that user returned a pre-semester survey, completed each of the cases assigned in the correct order, and made use of at least four separate steps in each case. These criteria assured that the data utilized met human subjects' protection requirements, the user made a reasonable attempt to follow course instructions, and that the user did not encounter insurmountable technical problems. Additional background data on case use was collected through the use of telephone interviews with each faculty or instructor using the cases following each semester.
Fall 2002 Essay Scores
Rubric
The first essay scoring rubric required the instructor to rate the student's essay on seven different criteria. A summary of the seven scoring criteria are provided in Table 1 below. Each criterion is modified to fit the eTIP used. Instructors were asked to score the essay on each criterion with a "0", generally indicating complete failure to fulfill the criterion; a "1" generally indicating weak or incomplete success in fulfilling the criterion; or a "2", generally indicating fulfillment of the criterion.
Table 1 . Summary of Rubric Score Criteria (Fall 2002)
|
Score |
Criterion |
|
1 |
Validation: Explains central challenge. |
|
2 |
Evidence: Identifies factors in the case related to the challenge. |
|
3 |
Evidence: Analyzes range of options for addressing challenge noting their advantages and disadvantages. |
|
4 |
Evidence: States a decision or recommendation for implementing an option or change in response to the challenge. |
|
5 |
Decision: Explains a justifiable rationale for the decision or recommendation. |
|
6 |
Decision: Describes anticipated results of implementing the decision or recommendation. |
|
7 |
Essay meets or does not meet expectations for all six decision making criteria. |
Sub-Sample
Five instructors (Instructor A, Instructor G, Instructor H, Instructor I, Instructor L) in six courses scored the essays of their students for the first case. Only Instructor G and Instructor I scored the essays of their students for the second case. Table 2 shows the characteristics of cases and number of students with scored essays. All essay scores will be used in analysis of the first case and Instructor G and Instructor I's essay scores will be used in analysis of changes over time in scores.
Table 2 . Essay Scores Sample (Fall 2002)
|
Instructor |
Course |
eTIP |
Level |
Number of Scores Case 1 |
Number of Scores Case 2 |
|
Instructor A |
Foundations |
2 |
Elementary |
9 |
0 |
|
Instructor G |
Foundations |
6 |
Elementary |
12 |
12 |
|
Instructor H 1 |
Methods |
1 |
Elementary |
16 |
0 |
|
Instructor H 2 |
Methods |
1 |
Elementary |
9 |
0 |
|
Instructor I |
Foundations |
2 |
Elementary |
5 |
5 |
|
Instructor L |
Foundations |
2 |
Secondary |
13 |
0 |
Results
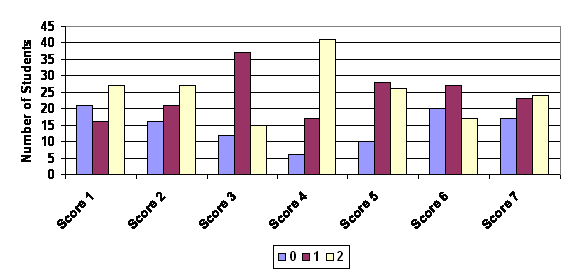
Table 3 below provides the descriptive statistics for essay scores on the first case. The scores appear evenly spread with most centered on the middle score of "1". The exception is Score 4 which is skewed towards higher values. Figure 1 below reflects this graphically. There is a modest tendency for students to be assigned scores of "1" or "2" more frequently than "0".
The skewness statistic is a measure of how evenly or symmetric the data are distributed around the mean value. A normal distribution, which has a skewness statistic equal to 0, has equal numbers of cases less than or greater than the mean. Its mean, median, and mode are all the same. Variables with a negative skewness statistic tend to have a long "tail" to the right of the mean. That is most of the cases are found on the lower end of the variable's range. Variables with a positive skewness statistic tend to have a long "tail" to the left of the mean. Most of the cases are found towards the lower end of the variables range. In Figure 1, score 3 is an example of a variable with a low level of skewness. The data are evenly divided on either side of the middle value of the variable. Score 4 is an example of a variable that is highly negatively skewed. Its "tail" is at the lower end and most of the cases have the highest value for that score.
Table 3 . Descriptive Statistics for Essay Scores on First Case (Fall 2002)
|
Mean |
Median |
Skewness |
|
|
Score 1 |
1.09 |
1 |
-.19 |
|
Score 2 |
1.17 |
1 |
-.33 |
|
Score 3 |
1.05 |
1 |
-.05 |
|
Score 4 |
1.55 |
2 |
* -1.18 |
|
Score 5 |
1.25 |
1 |
-.41 |
|
Score 6 |
0.95 |
1 |
.80 |
|
Score 7 |
1.11 |
1 |
-.20 |
* Indicates skewness score is twice the standard error of skewness.
Figure 1 . Assignment of Values by Score for Case 1 (Fall 2002)
A Kendall's W test, typically used to measure the agreement by a rater on multiple scores for the same individuals, is used to assess the degree to which the seven scores are rated in similar ways. The test takes examines pairs of cases to see whether they were scored similarly on pairs of variables. It would test, for example whether person A, who scored higher than person B on Score 1, also scored higher on Score 2? The test statistic then summarizes the degree of similarity or dissimilarity over the pair for all cases. A Bonferroni adjustment is used which adjusts the significance level downward to account for the relative abundance of tests conducted (α < .002). All pairs of variables were examined. Only Score 4 is rated higher than all other scores at statistically significant level as are Scores 5 and 6. There are no other statistically significant differences among the scores.
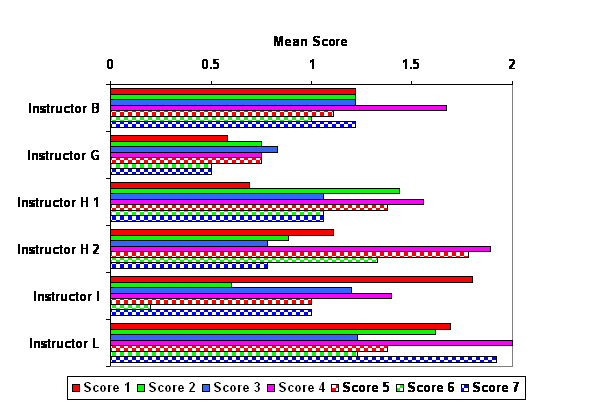
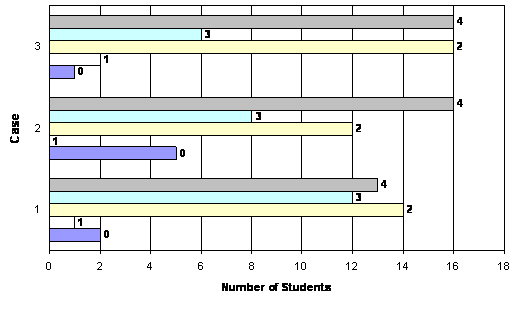
Figure 2 below shows the mean scores by class for the first case. The graph reveals considerable variation among classes in the mean scores. A series of Kruskal-Wallis tests were used to see whether there were statistically significant differences between classes in the medians for each scoring criteria. The Kruskal-Wallis test pools all the values for a given variable across groups (classes in these analyses) and ranks from highest to lowest. It then replaces the values with these ranks and tests whether the average rank differs by class. The level of statistical significance is adjusted to account for the fact that multiple significance tests tend to produce statistically significant results simply by chance (Bonferroni inequality). The typical level of statistical significance (α=.05) is divided by the number of tests to produce the level of statistical significance used below (α=.007). There were statistically significant differences between classes for Score 1 (X=17.100, p=.004), Score 4 (X=24.911, p < .001), and Score 7 (X=22.568, p < .001). There were no statistically significant differences between classes for Score 2 (X=11.701, p=.039), Score 3 (X=4.613, p=.465), Score 5 (X=12.317 p=.031), or Score 6 (X=13.684, p=.018).
Figure 2 . Mean Essay Scores by Score and Class (Fall 2002)
Given that there were three different eTIPs used among the six courses, it is difficult to tell whether the variations in scores are attributable to individual, instructor, course, or case differences. A few interesting comparisons are possible however. Instructor H used the eTIP 1 elementary case for two different sections of the same elementary science pedagogy course and implemented them in similar ways. A repetition of the Kruskal-Wallis tests, with adjustments to the level of statistical significance made for the number of tests (α=.007), was conducted comparing the median between the sections for all seven scores. The tests revealed no statistically significant differences between the two sections. The same type of analysis was run for Instructor A's, Instructor I's, and Instructor L's students, all of whom did eTIP 2 elementary for the first case. Again, there were no statistically significant differences between scores. Table 4 below provides Spearman correlation coefficients as a measure of association between scores in the first case. Each score correlates significantly with all other scores. Score 7 (overall score) appears to have the highest correlations with other scores but not dramatically so. The results suggest considerable conceptual overlap in the scoring criteria.
Table 4 . Spearman Correlations Between Scores in First Case (Fall 2002)
|
Score 1 |
Score 2 |
Score 3 |
Score 4 |
Score 5 |
Score 6 |
|
|
Score 2 |
** .57 |
|||||
|
Score 3 |
** .52 |
** .63 |
||||
|
Score 4 |
** .56 |
** .57 |
** .32 |
|||
|
Score 5 |
** .43 |
** .50 |
** .48 |
** .61 |
||
|
Score 6 |
** .37 |
** .54 |
** .49 |
** .55 |
** .76 |
|
|
Score 7 |
** .77 |
** .69 |
** .59 |
** .63 |
** .48 |
** .54 |
* p < .05, ** p < .01
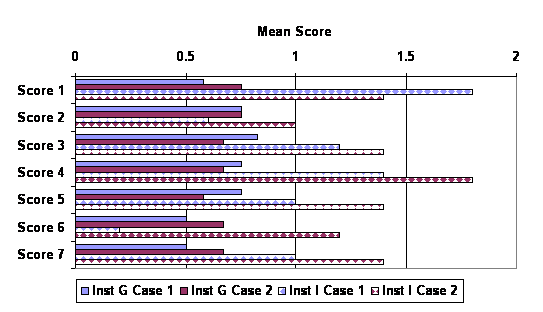
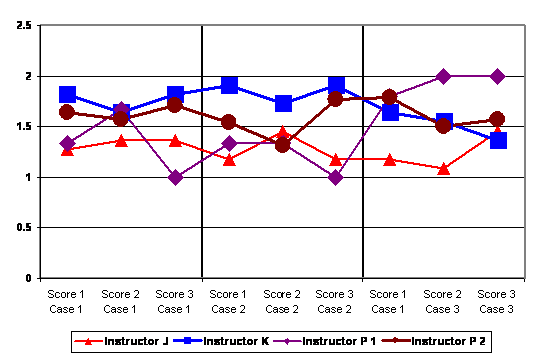
Figure 3 compares the first and second cases on the means for each score. Only Instructor G and Instructor I scored essays on the second cases and these results are shown separately for the two classes. There appears to be little change in the mean scores over time although there are strong differences between the two classes. Among Instructor G's twelve students, there were no statistically significant differences between how median scores on the first case and median scores on the second case (based on Wilcoxon Signed Ranks Test). The same was true for five students scored on both the first and second cases in Instructor I's course.
Figure 3 . Mean Scores for Case 1 and 2 by Class (Fall 2002)
Spring 2003 Essay Scores
Rubric
The essay scoring rubric was changed at the beginning of the spring 2003 semester. Instead of seven scores ranked from 0 to 2, it now used three scores ranked from 0 to 2. The criteria for the three scores are listed below in Table 5. Instructors were asked to score each essay for each of the three scores with a "0", generally indicating complete failure to fulfill the criterion; a "1" generally indicating weak or incomplete success in fulfilling the criterion; or a "2", generally indicating fulfillment of the criterion. In addition, a global score was automatically calculated by the software. Rules for calculating the global score are listed below in Table 6.
Table 5 . Summary of Rubric Score Criteria (Spring 2003)
|
Score |
Criterion |
|
1 |
Validation: Explains central challenge. |
|
2 |
Evidence: Identifies case information that must be considered in meeting the challenge. |
|
3 |
Decision: States a justified recommendation for implementing a response to the challenge. |
Table 6 . Summary of Decision Rules of Global Score (Spring 2003)
|
Value |
Decision Rule |
|
0 |
Does not meet expectation because the decision criterion (score 3) equals 0 or rubric is blank. |
|
1 |
Does not meet expectation because validation (score 1) and evidence (score 3) are both equal to 0. |
|
2 |
Somewhat meets because other conditions above are not met. |
|
3 |
Meets expectation because scores in both decision and validation, or decision and evidence equal 2. |
|
4 |
Exemplary because scores for all three criteria (validation, evidence, decision) equal 2. |
Sub-Sample
Five instructors in six courses scored student essays. Table 7 below presents the characteristics of these courses and the number of students scored. Instructor I assigned two cases to her students and hence scored the first two essays. Instructor O assigned three cases but did not score the first case as she viewed it as a practice case. The other instructors each assigned three cases to be completed individually and scored all three cases. Given that Instructor J, Instructor K, and Instructor P each assigned the same eTIP, the analysis of essay scores is restricted to the four courses in which they implemented the cases. This will aid comparison across courses by eliminating the possibility that differences between courses were due to slightly different rubrics.
Information from a user was included if that user returned a pre-semester survey, completed each of the cases assigned in the correct order, and made use of at least four separate steps in each case. These criteria assured that the data utilized met human subjects' protection requirements, the user made a reasonable attempt to follow course instructions, and that the user did not encounter insurmountable technical problems.
Table 7 . Essay Scores Sample (Spring 2003)
|
Instructor |
Course |
eTIP |
Level |
Case 1 |
Case 2 |
Case 3 |
|
Instructor I |
Foundations |
1 |
Elementary |
27 |
27 |
0 |
|
Instructor O |
Ed Tech |
2 |
Elementary |
0 |
19 |
17 |
|
Instructor J |
Ed Tech |
2 |
Secondary |
11 |
11 |
11 |
|
Instructor K |
Ed Tech |
2 |
Secondary |
11 |
11 |
11 |
|
Instructor P 1 |
Methods |
2 |
Elementary |
6 |
6 |
5 |
|
Instructor P 2 |
Methods |
2 |
Elementary |
14 |
13 |
14 |
Results
Table 8 below displays the mean, median, and skewness statistics for each of the three scores plus the global score by case. There appears to be little variation among the three scores in the means or medians. Most of the scores are skewed positively – that is they have more cases at higher values. Figure 4 below confirms this observation. Instructors gave only a handful of students a value of "0" for any score. They were also more likely to assign students a value of "2" than "1" for any score on any case. There is no systematic bias associated with any particular score however.
The global scores were more evenly distributed, although they were still biased towards the higher end of the range. This is in part due to the greater range of values available to be assigned. Figure 5 below shows the proportion of scores assigned by case to students. From seven to twelve percent of students received either a "0" or "1" depending on the case. The scores of "2" and "4" were assigned to approximately two-thirds of students for each case essay.
Table 8 . Descriptive Statistics for Essay Scores by Case (Spring 2003)
|
Case 1 (n=42) |
Case 2 (n=41) |
Case 3 (n=41) |
|||||||
|
Mean |
Median |
Skewness |
Mean |
Median |
Skewness |
Mean |
Median |
Skewness |
|
|
Score 1 |
1.55 |
2 |
-.930 + |
1.51 |
2 |
-1.14 + |
1.59 |
2 |
-1.28 + |
|
Score 2 |
1.55 |
2 |
-.930 + |
1.46 |
1 |
-.318 |
1.46 |
2 |
-.889 + |
|
Score 3 |
1.51 |
2 |
-1.14 + |
1.54 |
2 |
-1.24 + |
1.54 |
2 |
-.619 |
|
Global Score |
2.79 |
3 |
-.673 |
2.73 |
3 |
-.937 + |
2.83 |
3 |
-.368 |
+ Indicates skewness score is twice the standard error of skewness.
Figure 4 . Value of Scores Assigned by Score and Case (Spring 2003)
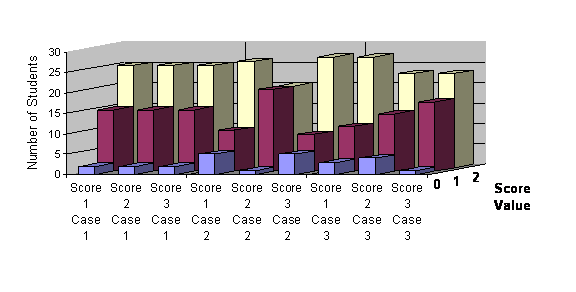
Figure 5 . Distribution of Global Scores by Case (Spring 2003)
A series of Spearman correlation coefficients were calculated between each of the three scores and global score over the three cases to examine the degree of correspondence between scores. These correlation coefficients are presented below in Table 9. Within each case, the correlations between each of the three scores and global score were high and statistically significant. This suggests the scoring rubric "hangs together" or otherwise taps into overlapping concepts in the minds of the instructors.
Not surprisingly, the global score was strongly associated with each of the three scores. The formula for calculating the global score is not a perfect linear combination the three variables, however, so the correlation is not 1. The correlation between the global score and Score 3 is especially strong reflecting the how the global score calculation rules disproportionately weight the performance on Score 3. Scores correlated over time as well. That is an individual receiving a low score on one criterion was likely to receive a low score on other criteria. The pattern of association across cases was strongest between the first and second cases. It was weak between the first and third cases. The scores on the second and third cases were not correlated however.
Table 9 . Spearman Correlations Between Scores by Case (Spring 2003)
|
Case 1 |
|||||||||||||
|
Case 1 |
Criteria |
1 |
2 |
3 |
Global |
||||||||
|
1 |
1.000 |
||||||||||||
|
2 |
-.011 |
1.000 |
|||||||||||
|
3 |
**.546 |
.287 |
1.000 |
||||||||||
|
Global |
**.624 |
**.492 |
**.904 |
1.000 |
Case 2 |
||||||||
|
Case 2 |
Criteria |
1 |
2 |
3 |
Global |
||||||||
|
1 |
.035 |
**.535 |
*.368 |
**.409 |
1.000 |
||||||||
|
2 |
*.312 |
**.409 |
*.312 |
**.452 |
**.473 |
1.000 |
|||||||
|
3 |
.242 |
**.425 |
**.443 |
**.501 |
**.590 |
**.538 |
1.000 |
||||||
|
Global |
.266 |
**.505 |
**.432 |
**.565 |
**.721 |
**.799 |
**.827 |
1.000 |
Case 3 |
||||
|
Case 3 |
Criteria |
1 |
2 |
3 |
Global |
||||||||
|
1 |
**.441* |
**.600 |
**.441 |
**.555 |
.281 |
.140 |
.300 |
.176 |
1.000 |
||||
|
2 |
*.314 |
*.373 |
.231 |
.242 |
.191 |
.148 |
.188 |
.079 |
**.601 |
1.000 |
|||
|
3 |
.247 |
**.477 |
.247 |
*.324 |
-.016 |
.194 |
.147 |
.101 |
**.542 |
**.557 |
1.000 |
||
|
Global |
.300 |
**.494 |
.254 |
*.344 |
.097 |
.179 |
.162 |
.106 |
**.680 |
**.730 |
**.893 |
1.000 |
* p < .05, ** p < .01
Figure 6 below examines change in essay scores over time broken down by the four classes. The global score is not shown because it uses a different range of scores. What is striking about this figure is the high level of stability shown across scores and across cases. A series of Wilcoxon Signed Rank tests was used to compare changes in scores from the first to second case and the second case to third case for each class. A Bonferroni adjustment is made to the significance level to take into account the 24 tests being conducted (α=.002). None of the differences over time were statistically significant.
Figure 6 Mean Scores by Class and Score (Spring 2003)
To the extent that there are differences within Figure 6, they appear to be a function of instructor and course. A series of Kruskal-Wallis tests were used to compare whether the four classes differed on median scores on each of the three criteria plus the global score. This analysis was repeated for each case. A Bonferroni adjustment is made to the significance level to take into account the 48 tests being conducted (α=.001). None of the scores differed at a statistically significant level for any of the cases.
Discussion
All scores demonstrated use of the full range of possible assigned values. In both semesters, the scores had similar distributions to one another although those distributions varied by semester. The exception is Score 4 in fall 2002 which asks students to state a decision or recommendation to meet the challenge. This was, not surprisingly, scored at a higher level than other scores from that semester. The criterion could merely be interpreted as whether the student attempted to answer the question or not.
An interesting pattern emerges by comparing essay scores between semesters. There appeared to be more frequent use of the "0" rating for each of the seven scores used in fall 2002 than for the three scores used in spring 2003. In general, scores in spring 2003 were more skewed towards positive values than scores in fall 2003 though both sets of scores tended to display a greater frequency of higher values. One explanation for the difference between semesters is that since the spring 2003 scores were defined more broadly than those in fall 2002, it was easier for students to have written on some component of the score rather than miss it entirely. Another explanation is that instructors were more reluctant to assign a score of "0" when students had only three opportunities to do well than when students had seven opportunities.
In both semesters, essay scores were associated with each other. As a student scored well on one score, that student would also tend to do well on a different score for the same case. This suggests two possibilities. First, responses to the case challenge are driven by a single student characteristic (e.g. general writing ability or the ability to use case information to make a justified technology decision) or that instructors see a high level of conceptual overlap among the scoring criteria. Second, a single characteristic is supported by all criteria of the rubric as used by these instructors. The use of an overall or global score receives some validation because of this high degree of association.
Possible sources of variation in essay scores included the case rubric, the instructor, course or course section, and student. While the above analyses are limited by the available data, they suggest that case rubric did contribute to variation in scores. That is courses using different eTIPs which in turn modified the rubric, received different scores. Different courses using the same eTIP, whether or not they had the same instructor, did not appear to have significantly different score distributions. This is modest evidence for the stability and validity of the rubric. Based on correlations among scores, there is evidence for moderate variation in scores attributable to students also.
There was no evidence of systematic change over time in individual student essay scores across cases. In both fall 2002 and spring 2003 semesters, students' essays were not rated higher on subsequent cases than earlier ones. There was, however, some evidence for individual-level stability in essay scores across cases. This suggests that, as measured by essay scores, there was no significant improvement in students' abilities to answer the case challenges between the fall and spring based on the use of two or at most three online case experiences.
Appendix A. Example of Case Challenge & Essay Response
The following is taken from a case used by a test-bed course in Spring 2003.
eTIP 2: Cold Spring Middle School Case Challenge
This case will help you practice your instructional decision making about technology integration. As you complete this case, keep in mind eTIP 2: technology provides added value to teaching and learning. Imagine that you are midway through your first year as a seventh grade teacher at Cold Springs Middle School, in an urban location. A responsibility of all teachers is to differentiate their lessons and instruction in order to accommodate for the varying learning styles, abilities, and needs of students in their classrooms and to foster students' critical and creative thinking skills. As a new teacher at Cold Springs Middle School, you will be observed periodically throughout the first few years of your career. One of the focuses of these observations is to analyze how well your instructional approaches are accommodating students' needs. The principal, Dr. Kranz, was pleased with your first observation. For your next observation she challenged you to consider how technology can add value to your ability to meet the diverse needs of your learners, in the context of both your curriculum and the school's overall improvement efforts.She will look for your technology integration efforts during your next observation.
On the case's answer page, you will be asked to address this challenge by making three responses:
1. Confirm the challenge: is the central technology integrationWhat challenge in regard to student characteristics and needs present within your classroom?
2. Identify evidence to consider: What case information must be considered in a making a decision about using technology to meet your learners' diverse needs?
3. State your justified recommendation: What recommendation can you make for implementing a viable classroom option to address this challenge?
Examine the school web pages to find the information you need about both the context of the school and your classroom in order to address the challenge presented above. When you are ready to respond to the challenge, click "submit answer".
Sample Response to Challenge
"I am a biology teacher and I think the current technology at Cold Springs Middle School is phenomenal. I would use both the Dynamic Human 3-D software as well as the Biolab Frog simulation in my classroom. These would engage the students in hands-on activities dealing with biology. Critical thinking skills could be developed by having the students analyze data and its implications. For instance, students could predict what would happen to the frog if carbon dioxide gas was introduced. They could simulate how this would affect the frog's respiration and compare this to their predictions.
This technology could apply to all of our students in biology at CSMS. Our student body is a diverse group as far as ethnicity is concerned. However, these specific technolgies are universal in their coverage of science concepts. Incidentally, the great thing about many software programs is that they are in different languages or have the option to use different languages.
In order to increase the school's overall performance many aspects of technology could be utilized. The school would better meet standards if it were using software that was approved for teaching standards. Since all the students have computers they should be used to their full capacity. Continual review of software and uses should be undertaken at committe meetings. The working together of people dedicated to integrating technology would be the most useful way to do so."
[1] These six principles state the conditions under which technology use in schools has been demonstrated to be most effective. Case 1: Learning outcomes drive the selection of technology. Case 2: Technology provides added value to teaching and learning. Case 3: Technology assists in the assessment of learning outcomes. Case 4: Ready access to supported, managed technology is provided. Case 5: Professional development targets successful technology integration. Case 6: Professional community enhances technology integration and implementation. See Dexter, S. (2002). eTIPS-Educational technology integration and implementation principles. In P. Rodgers (Ed.), Designing instruction for technology-enhanced learning (pp.56-70). New York: Idea Group Publishing.