ETIPS - Make Thinking Visible
Technical Paper 4: ETIP Essay Scores, Relevancy, and Case Search
Eric Riedel, Ph.D.
Center for Applied Research and Educational Improvement (CAREI)
University of Minnesota
David Gibson, Ph.D.
The Vermont Institutes
Shyam Boriah
Center for Applied Research and Educational Improvement (CAREI)
University of Minnesota
Abstract:
The appropriateness of a 2 x 2 typology of case users was explored using data from the first year of field testing. The typology was based on the interactions between two measures: quality of case essays and degree of expertise in case search (relevancy). The typology includes four types of users: (1) those having a high quality essay and relevant search; (2) those having a low quality essay but relevant search; (3) those having a high quality essay and irrelevant search; and (4) those having a low quality essay and irrelevant search. The validity of the typology was confirmed through an examination of the case search characteristics of each of the four types of users. Those having an irrelevant search typically accessed much less information than those having a relevant search although they tended to focus heavily on information about available technology (without hitting relevant items). There were users, however, who could offer a thoughtful essay response without relying on relevant case information. Nevertheless, access to relevant case information does not guarantee that users will translate such information into a high quality essay response about the case.
Original draft released on May 3, 2004. Final draft released on April 24, 2005. Correspondence regarding this paper can be directed to the first author at the Center for Applied Research and Educational Improvement (CAREI), University of Minnesota, 275 Peik Hall, 159 Pillsbury Avenue SE, Minneapolis, MN 55455, riedel@umn.edu .
Executive Summary
The following paper examines how a typology which combines relevancy and essay scores relates to the actual search of a case. Users were separated into having strong or weak essays and having high or low measures of search relevancy. Category 1 users (strong essay, high relevancy) were thought to have searched out and used case information. Category 2 users (weak essay, high relevancy) were thought to have accessed relevant case information but be unable to recognize or articulate it as such. Category 3 users (strong essay, low relevancy) were thought to have written the essay without examining the case. Category 4 users (weak essay, low relevancy) were thought not to have searched the case and not provided any relevant information in their essay. Users were identified using the top and bottom quartiles on each dimension and so only half of the available sample was included in the analysis.
An examination of the case searches for users in each category appeared to confirm the typology. Category 1 and 2 users consistently took more steps through the cases than other types of users and appeared to have recognized relevant information. Category 3 and 4 users appeared to have difficulty in identifying relevant items. Both types tended to access the Technology Infrastructure category heavily but still had difficulty identifying relevant information even in that category. In general, those users who wrote high quality essays tended to score high on all elements of the essay scoring rubric while those who wrote low quality essays tended to score low on all elements. There was an exception for parts of the rubric in which users received points for stating a decision in the case which suggests that simply announcing the decision was not strongly linked to the case search.
Introduction
The Educational Theory into Practice Software (ETIPS) originated with a grant in 2001 from the U.S. Department of Education's Preparing Tomorrow's Teachers to Use Technology (PT3) program. Since its inception these online cases were designed to provide a simulated school setting in which beginning teachers could practice decision-making regarding classroom and school technology integration guided by the Educational Technology Integration and Implementation Principles (eTIPs). In each case, users are given a case challenge based on one of these six principles about how they would use educational technology in the specific scenario[1]. They then can search out information about the school staff, students, curriculum, physical setting, technology infrastructure, community, and professional development opportunities. After responding to the case challenge in the form of a short essay, users are given feedback about their essay and case search. (Readers can view cases at http://www.etips.info/.)
The present paper draws on research and evaluation data gathered on the actual use of the cases during part of the 2002-2003 field test of the cases. It is part of a series of technical papers aimed at informing project staff, users of these cases, and researchers of educational technology more generally. The purpose of this paper is to examine the relationship between essay scores, relevancy and the actual search of the case. More specifically, the purpose is to explore a hypothetical typology of users based on essay scores and the relevancy of their search.
Earlier work on users of ETIP cases theorized that while a high quality case essay should be based on a careful search of the case, this would not always be true among actual users (Dexter, Greenhow, & Hughes, 2003; Dexter & Riedel, 2002; Dexter & Greenhow, 2002). Specifically, there are users who could rely on their writing skill to achieve a high quality essay rather than a focused search. Likewise there are users who would have difficulty recognizing or explicating the information found in a careful search. It was theorized that a combination of essay scores and relevancy measures could help to illuminate the user's experience with the cases. A two by two table outlining how essay and relevancy measures relate to the user's experience of the cases is shown below in Table 1. Category 1 users (strong essay, high relevancy) were thought to have searched out and used case information. Category 2 users (weak essay, high relevancy) were thought to have accessed relevant case information but be unable to recognize or articulate it as such. Category 3 users (strong essay, low relevancy) were thought to have written the essay without examining the case. Category 4 users (weak essay, low relevancy) were thought not to have searched the case and hence not provided any relevant information in their essay.
Table 1 . Typology of ETIP Case Users
|
RELEVANCY TOTAL |
ESSAY SCORE |
|
|
Strong |
Weak |
|
|
High |
Category 1 Searched out and used case information. |
Category 2 Case information not recognized or articulated |
|
Low |
Category 3 Wrote without examining situation. |
Category 4 No case information sought and little provided. |
This classification is operationalized in the following analysis by selecting the top or bottom quartile of users for each of the two measures. The following analysis assesses the validity of each type by comparing the four categories across characteristics of case search including the number of steps taken and attention to each of the information categories in the case.
Sample
The sample of users is drawn from test-bed courses that implemented the ETIP cases in fall 2002 and spring 2003. Information from a user was included if that user returned a pre-semester survey, completed each of the cases assigned in the correct order, and made use of at least four separate steps in each case. These criteria assured that the data utilized met human subjects' protection requirements, the user made a reasonable attempt to follow course instructions, and that the user did not encounter insurmountable technical problems.
For both semesters we analyze only the first case completed by users. The sample is also restricted to those cases involving eTIP 2. The fall 2002 sample included three foundations courses taught by different faculty with a total of 27 students. (See Table 2.) The spring 2003 sample included four courses (two educational technology, two methods) taught by three instructors with a total of 42 students. (See Table 3.)
Table 2 . Sample of Essay Scores for Fall 2002
|
Instructor |
Course |
Level |
Number of Students |
|
Instructor A |
Foundations |
Elementary |
9 |
|
Instructor I |
Foundations |
Elementary |
5 |
|
Instructor L |
Foundations |
Secondary |
13 |
Table 3 . Sample of Essay Scores for Spring 2003
|
Instructor |
Course |
Level |
Number of Students |
|
Instructor J |
Ed Tech |
Secondary |
11 |
|
Instructor K |
Ed Tech |
Secondary |
11 |
|
Instructor P 1 |
Methods |
Elementary |
6 |
|
Instructor P 2 |
Methods |
Elementary |
14 |
Measures
Relevancy of case search is defined according to expert judgments by project staff as to which pieces of information in the case were relevant to answering the case question. An information item was assigned a weight of 2 if relevant, 1 if semi-relevant, or 0 if not relevant. Relevancy was assigned differently depending on what eTIP the case addressed. An example of a case question along with what information items in the case are relevant to the case question is provided in Appendix A. Based on results from an earlier technical paper (number two), the actual count of separate relevant information items accessed constitutes the main measure of search relevancy in the present analysis.
The analysis was conducted separately for the two semesters because the fall 2002 cases followed a six-criteria essay scoring rubric, while the spring 2003 cases followed a three-criteria essay scoring rubric. Each rubric contained criteria addressing evidence related to case question, validation of case question, and decision answering case question. (See Appendix B.) Each criterion was scored as 0 (not fulfilled), 1 (partially fulfilled), or 2 (fulfilled). Summary essay score measures were created for each semester by adding together all criteria for the rubric used in that semester.
Figure 1 shows the distribution of essay scores and relevancy for Fall 2002 users. Essay scores ranged from 2 to 12, while relevancy ranged from 1 to 10.
Figure 1 . Box Plot of Essay Scores and Relevancy (Fall 2002)
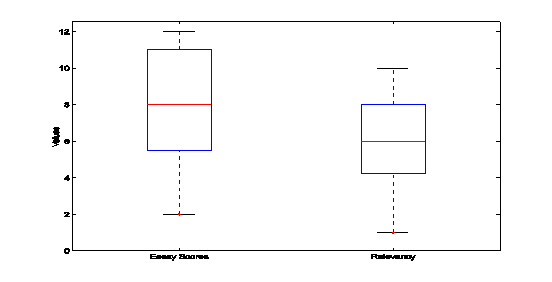
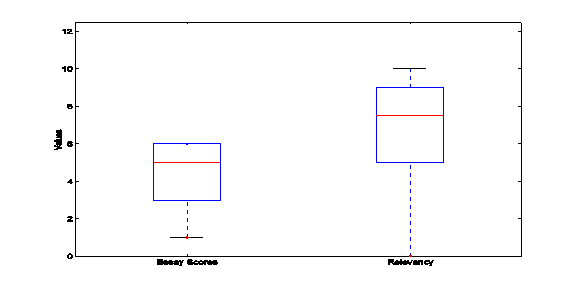
Figure 2 shows a box plot of essay scores and relevancy for spring 2003. Essay scores ranged from 1 to 6, while relevancy ranged from 0 to 10. Essays in spring 2003 were scored using a three score rubric, while those in fall 2002, used a six score rubric – this meant that the maximum essay score for spring 2003 was 6 while for fall 2002 it was 12.
Figure 2 . Box Plot of Essay Scores and Relevancy (Spring 2003)
Fall 2002 Results
Table 4 is a summary of how the fall 2002 users were classified. For each category of users the following information is listed: the essay score and relevancy percentile for that category, the number of users and percentage of sample that were classified as belonging to this category, the range of essay score totals and number of relevant items, and finally the median number of steps taken by users in the category.
Table 4 . Fall 2002 User Data by Category
|
Essay Score Percentile |
Relevancy Percentile |
Number of users |
Essay Score Total |
Number of relevant items accessed |
Median number of steps taken |
|
|
Category 1 |
Highest 25% |
Highest 25% |
3 (11%) |
11 – 12 |
8 – 10 |
33 |
|
Category 2 |
Lowest 25% |
Highest 25% |
3 (11%) |
2 – 5 |
8 – 10 |
21 |
|
Category 3 |
Highest 25% |
Lowest 25% |
1 (4%) |
11 – 12 |
1 – 4 |
21 |
|
Category 4 |
Lowest 25% |
Lowest 25% |
2 (7%) |
2 – 5 |
1 – 4 |
13 |
Figure 3 shows how users of each category accessed the information categories found in the case – for each user, the percentage of her/his total steps in each information category are calculated and the graph the presents the mean for all users in each category. For example, the figure shows that approximately half of the pages visited by Category 3 users were to pages in the Technology Infrastructure information category. For each user category, the percentage of accesses over all information categories adds up to 100 percent.
The categories which contain relevant items as defined by project experts are listed in Table 2. Curriculum and Assessment and Technology Infrastructure information categories have most of the relevant items. Figure 3 shows that approximately 60 percent of the steps for users in Category 1 and Category 2 were to these two information categories. Users in Category 1 and Category 2 searched the case in a similar fashion. While searches of users in Category 3 and Category 4 were not as similar to each other, they were very different from Category 1 and Category 2 users. Category 1 and 2 users took more steps through the case and appear to have recognized relevant information in the case. Category 3 and 4 users appear to have had difficulty in identifying relevant items – even though more than 50 percent of their accesses were to Technology Infrastructure, their relevancy total suggests that they did not access the relevant items.
Figure 3 . Access Patterns to Information Categories (Fall 2002)
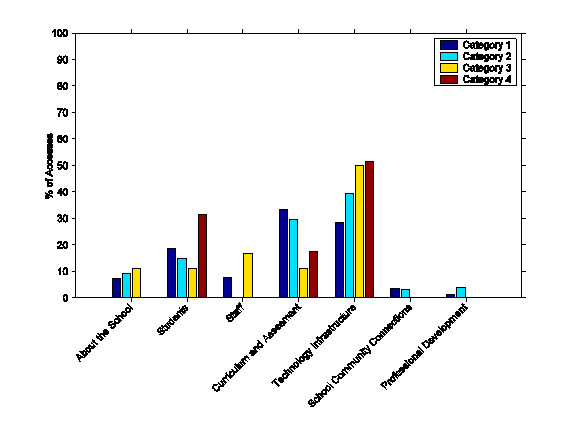
Table 5 . Information Categories and the Number of Relevant Items
|
Category |
Number of Relevant Items / Total Number of Items |
|
About the School |
0 / 4 |
|
Students |
2 / 6 |
|
Staff |
0 / 11 |
|
Curriculum and Assessment |
4 / 8 |
|
Technology Infrastructure |
4 / 12 |
|
School Community Connections |
0 / 6 |
|
Professional Development |
0 / 20 |
|
Total |
10 / 67 |
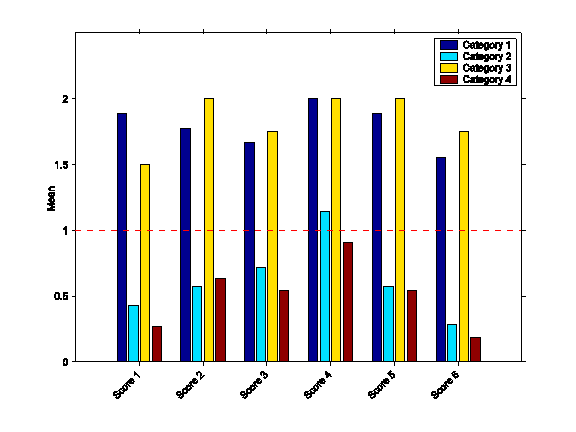
Figure 3 shows the mean essay score obtained on each scoring criterion (defined in Appendix B) by users of all categories. A score of 1 (dashed line in Figure 3) generally indicates weak or incomplete success in fulfilling the criteria. We see from Figure 3 that users in Category 1 and Category 3 were successful in fulfilling nearly all the criteria – a total score of 10 out of 12 means that these users received a "2" on nearly all the criteria. This shows that these users wrote strong essays that fulfilled all scoring criteria overall. For users in Category 2 and Category 4, Score 4 is the only scoring rubric with a value more than 1 – this criterion could be interpreted as whether the user attempted to answer a question or not. The average score on all other rubrics was lower than 1. The users scored lowest on Scores 1 and 6. Thus, users in Category 2 and Category 4 were unable to get much further than making an attempt to give responses to questions.
Figure 4 . Essay Score Means for each Scoring Criterion (Fall 2002)
Spring 2003
Table 4 is a summary of the user data for the various categories. As shown for fall 2002, the following are listed for each category of users: essay score and relevancy percentile, the number of users and percentage of sample that were classified as belonging to each category, the range of essay score totals and number of relevant items, and finally the median number of steps taken by users in each category.
Table 6 . Spring 2003 User Data by Category
|
Essay Score Percentile |
Relevancy Percentile |
Number of users |
Essay Score Total |
No. of relevant items accessed |
Median no. of steps taken |
|
|
Category 1 |
Highest 25% |
Highest 25% |
9 (12%) |
6 |
9 – 10 |
33 |
|
Category 2 |
Lowest 25% |
Highest 25% |
2 (3%) |
1 – 3 |
9 – 10 |
31 |
|
Category 3 |
Highest 25% |
Lowest 25% |
4 (6%) |
6 |
0 – 5 |
9 |
|
Category 4 |
Lowest 25% |
Lowest 25% |
8 (11%) |
1 – 3 |
0 – 5 |
14 |
Figure 5 . Access Patterns to Information Categories (Spring 2003)
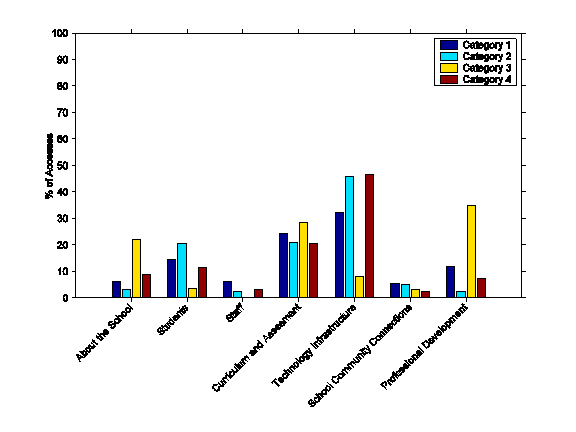
Figure 4 shows how users of each category accessed the information categories found in the case – for each user, the percentage of her/his total steps for each information category are calculated and the figure then shows the mean for all users in each category. For example, the figure tells us that approximately half of the pages visited by Category 4 users were to pages in the Technology Infrastructure information category. For each user category, the percentage of accesses over all information categories adds up to 100 percent.
The relevant items for eTIP 2 as defined by project experts are listed in Table 5. Curriculum and Assessment and Technology Infrastructure are the two information categories that contain most of the relevant items. Figure 4 shows that users in Category 1 and 2 paid the most attention to these two categories. Category 3 users mostly accessed categories that did not contain relevant items while Category 4 users focused on the Technology Infrastructure category.
Looking at the number of relevant items accessed and the information categories accessed, Category 1 and 2 users were able to identify most of the relevant items in the case. Category 3 and 4 users seem to have had difficulty in identifying relevant items – Category 3 users accessed mostly categories that did not contain relevant information, while Category 4 users were not able to identify the relevant items in the Technology Infrastructure category even though approximately half of their accesses were to this category. Category 1 and 2 users took more than twice as many steps as those in Category 3 and 4 and performed a more thorough search of the case in that they looked at all sections of the case to find the relevant ones.
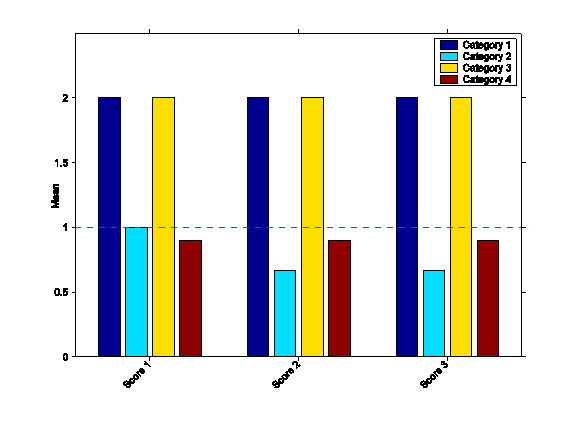
Figure 5 shows the mean essay score obtained on each scoring criterion (defined in Table 5) by users of all categories. A score of 1 (red line in Figure 5) generally indicates weak or incomplete success in fulfilling the criteria (see Appendix B). Figure 5 shows that Category 1 and 3 users received a "2" on all three scoring rubrics. This shows that these users wrote strong essays that fulfilled all scoring criteria overall. Category 2 and 4 users on average did not receive a "1" on any of the scoring rubrics. These users appear to have had difficulty writing an essay that met any of the scoring criteria.
Figure 6 . Essay Score Means for each Scoring Criterion (Spring 2003)
Discussion
This paper examined how the number of relevant items accessed by users in a case and essay scores relate to the actual search of a case. It focused on four user types, defined by the intersection of relevancy and essay quality. Users with high relevancy performed searches that targeted information categories in the case that contained relevant items, i.e., these users were able to identify relevant information across the case. Users with low relevancy seemed to focus on one information category, Technology Infrastructure, suggesting that they were unable to identify all the relevant items – they also did not take as many steps as users with high relevancy suggesting that their search was not as thorough or complete. Users with strong essays received high scores on all rubrics used to score the essays, while those with low essay scores scored high on the decision criterion to the extent they scored high on any of the essay rubric criteria.
Relevancy and essay quality measures could be combined in four ways and data from fall 2002 and spring 2003 semesters demonstrated that users existed in each of the four categories. Each user category appeared to exhibit unique patterns of searching the cases and using that information in the essay. In other words, there is empirical support for the validity of the four category typology presented in this paper. These user types can be defined by: (1) high relevancy and strong essays and having searched out and used relevant information, (2) high relevancy and weak essays and unable to articulate information, (3) low relevancy and strong essays and writing good essays without fully examining the situation, and (4) low relevancy and weak essays and seeking little information and provided little information in their essay.
References
Greenhow, C., Dexter, S., & Hughes, J. (April, 2003). "Teacher knowledge about technology integration: Comparing the decision-making processes of preservice and in-service teachers about technology integration using Internet-based simulations." Presented at the annual meeting of the American Educational Research Association. Chicago, IL.
Dexter, S. & Riedel, E., (June, 2002). "Adding Value to Essay Question Assessments with Search Path Data." Presented at the 2002 annual meeting of the National Educational Computing Association. San Antonio, TX.
Dexter, S. & Greenhow, C. (February, 2002). "Learning Technology Integration and Performance Assessment with Online Decision Making Software." Presented at the 2002 annual meeting of the American Association of Colleges for Teacher Education.
Appendix A: Example of Case with Relevant Items Highlighted
The following example illustrates how relevancy is applied in one of the ETIP cases. It is taken from a case with an urban, middle school called Cold Spring in which the instructor assigned questions pertaining to eTIP2 ("added value"). The case challenge reads as follows:
This case will help you practice your instructional decision making about technology integration. As you complete this case, keep in mind eTIP 2: technology provides added value to teaching and learning. Imagine that you are midway through your first year as a seventh grade teacher at Cold Springs Middle School, in an urban location. A responsibility of all teachers is to differentiate their lessons and instruction in order to accommodate for the varying learning styles, abilities, and needs of students in their classrooms and to foster students' critical and creative thinking skills. As a new teacher at Cold Springs Middle School, you will be observed periodically throughout the first few years of your career. One of the focuses of these observations is to analyze how well your instructional approaches are accommodating students' needs. The principal, Dr. Kranz, was pleased with your first observation. For your next observation she challenged you to consider how technology can add value to your ability to meet the diverse needs of your learners, in the context of both your curriculum and the school's overall improvement efforts.She will look for your technology integration efforts during your next observation.
On the case's answer page, you will be asked to address this challenge by making three responses:
1. Confirm the challenge: is the central technology integrationWhat challenge in regard to student characteristics and needs present within your classroom?
2. Identify evidence to consider: What case information must be considered in a making a decision about using technology to meet your learners' diverse needs?
3. State your justified recommendation: What recommendation can you make for implementing a viable classroom option to address this challenge?
Examine the school web pages to find the information you need about both the context of the school and your classroom in order to address the challenge presented above. When you are ready to respond to the challenge, click "submit answer".
After reading the challenge, the user would then search for information relevant to the questions posed. The table below lists all the information categories and individual items in those categories available for searching in all cases. The information items relevant to this particular case (eTIP 2) are highlighted. Relevant information is in bold and semi-relevant information is in bold and italics. Note that this table serves as a key for examination of individuals in two selected classes presented later in the paper.
Table A .1. Sample Problem Space with Relevant Information
|
CATEGORY |
INDIVIDUAL INFORMATION ITEMS |
|
Prologue (1) |
Prologue=1 |
|
About the School (2-11) |
Mission Statement=2; School Improvement Plan=3; Facilities=4; School Map=5; Student Demographics=6; Student Demographics Clipping=7; Performance=8; Schedule=9; Student Leadership=10; Student Leadership Artifact=11 |
|
Staff (12-22) |
Staff Demographics=12; Staff Demographics Talk=13; Mentoring=14; Staff Leadership=15; Staff Leadership; Talk=16; Faculty Schedule=17; Faculty Meetings=18; Faculty Talk=19; Faculty Meetings Artifact=20; Faculty Contract=21; Faculty Contract Talk=22 |
|
Curriculum and Assessment (23-30) |
Standards=23; Instructional Sequence=24; Computer Curriculum=25; Classroom Pedagogy and Assessment=26 ; Teachers=27; Talk=28; Talk 2=29; Clipping=30 |
|
Technology Infrastructure (31-42) |
School Wide Facilities=31; Library / Media Center=32; Classroom-Based Facilities=33 ; Classroom-Based Software Setup=34; Community Facilities=35; Technology Support Staff=36; Policies and Rules=37; Policies Clipping=38; Technology Committee=39; Technology Committee Talk=40; Technology Survey Results=41; Technology Plan and Budget=42 |
|
School Community Connections (43-48) |
Family Involvement=43; Family Involvement Clipping=44; Business Involvement=45; Business Involvement; Clipping=46; Higher Education Involvement=47; Community Resources=48 |
|
Professional Development (49-68) |
Professional Development Content=49; Professional Development Content Area=50; Resources=51; Professional Development Leadership=52; Professional Leadership=52; Professional Leadership Talk=53 Professional Development Talk=53; Learning Community=54; Learning Community Talk=55; Professional Development Process Goals=56; Professional Development Data=57; Professional Development Data; Artifact=58; Professional Development Evaluation=59; Professional Development Evaluation Talk=60; Professional Development Research=61; Professional Development Research Artifact=62; Professional Development Design=63; Professional Development Design Talk=64; Professional Development Learning=65 Professional Development Learning Artifact=66; Professional Development Collaboration=67; Professional Development Collaboration Artifact=68 |
|
Epilogue (69) |
Epilogue=69 |
|
Essay (70) |
Essay=70 |
Bold items have high relevance. Bold, italicized items have medium relevance.
Appendix B: Essay Score Rubrics
Table B .1. Summary of Rubric Score Criteria (Fall 2002)
|
Score |
Criterion |
|
1 |
Validation: Explains central challenge. |
|
2 |
Evidence: Identifies factors in the case related to the challenge. |
|
3 |
Evidence: Analyzes range of options for addressing challenge noting their advantages and disadvantages. |
|
4 |
Evidence: States a decision or recommendation for implementing an option or change in response to the challenge. |
|
5 |
Decision: Explains a justifiable rationale for the decision or recommendation. |
|
6 |
Decision: Describes anticipated results of implementing the decision or recommendation. |
|
7 |
Essay meets or does not meet expectations for all six decision making criteria. |
Table B.2. Summary of Rubric Score Criteria (Spring 2003)
|
Score |
Criterion |
|
1 |
Validation: Explains central challenge. |
|
2 |
Evidence: Identifies case information that must be considered in meeting the challenge. |
|
3 |
Decision: States a justified recommendation for implementing a response to the challenge. |
[1] These six principles state the conditions under which technology use in schools has been demonstrated to be most effective. Case 1: Learning outcomes drive the selection of technology. Case 2: Technology provides added value to teaching and learning. Case 3: Technology assists in the assessment of learning outcomes. Case 4: Ready access to supported, managed technology is provided. Case 5: Professional development targets successful technology integration. Case 6: Professional community enhances technology integration and implementation. See Dexter, S. (2002). eTIPS-Educational technology integration and implementation principles. In P. Rodgers (Ed.), Designing instruction for technology-enhanced learning (pp.56-70). New York: Idea Group Publishing.
